Last updated:

This is a one-of-a-kind collection of data on the status of electricity deregulation in the United States.
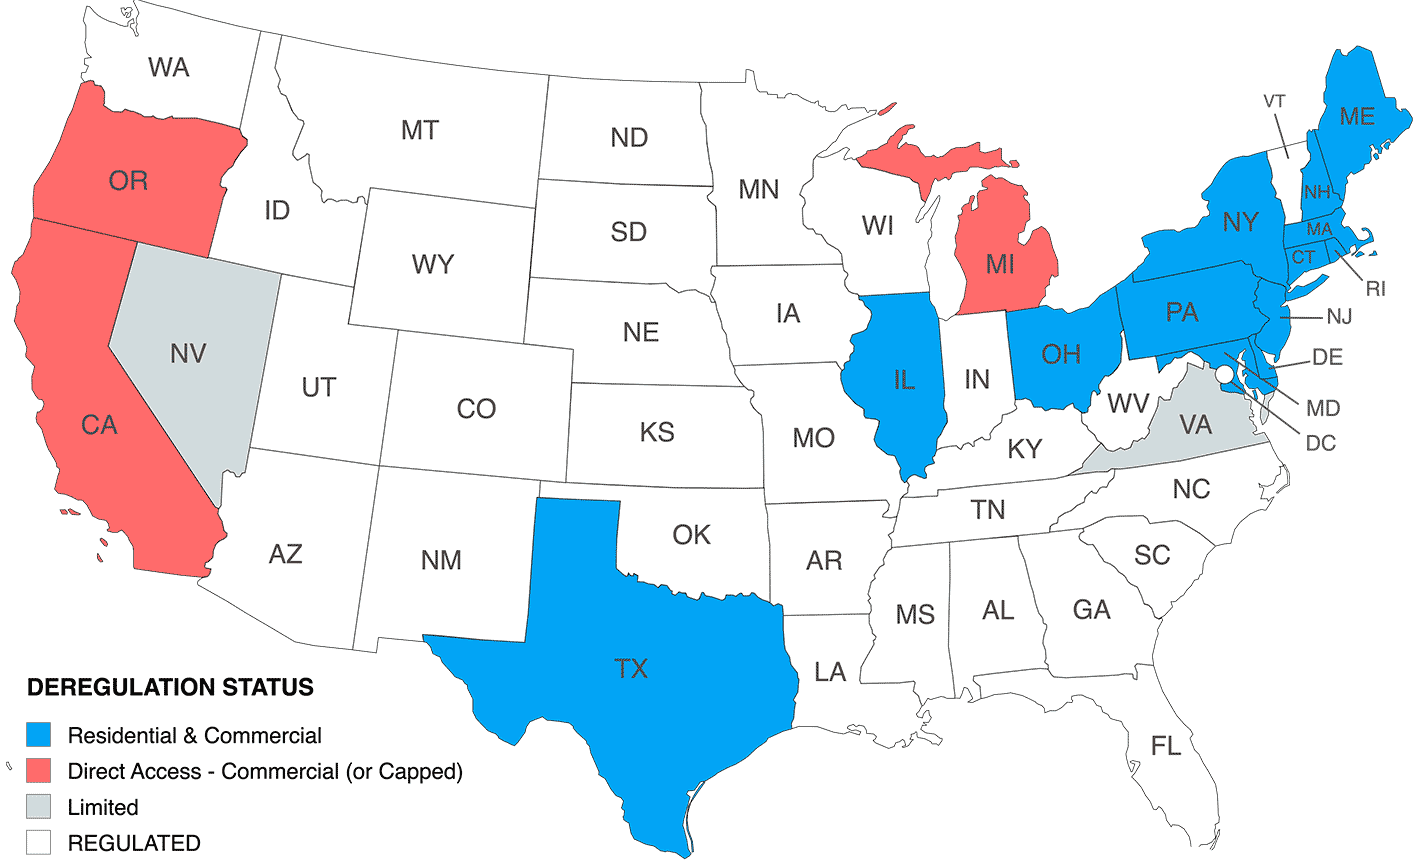
Map showing states that have a deregulated electricity market (2025).

17+ million
Homes Have Switched
3.6+ million
Businesses Have Switched
18 states
With Some Choice
Guide to the Data

Estimates are used where official statewide counts aren’t published. Residential choice is 0% where no residential retail choice exists. “Limited / Capped” indicates constrained C&I programs.

  • Customer Eligibility: Classes allowed to choose a supplier.

  • Switching Rate: Share of eligible customers who switched.

  • Switched Customers: Estimated customers served by competitive suppliers.

  • Market Notes: Year & key rules shaping the market.

Texas

ResidentialCommercialIndustrial

Residential

Switching Rate
87%
Switched Customers≈10,664,000

Commercial & Industrial

Switching Rate
87%
Switched Customers≈1,683,000
Deregulated in 2002. Mandatory-choice market for most of the state.

Ohio

ResidentialCommercialIndustrial

Residential

Switching Rate
57%
Switched Customers2,350,000

Commercial & Industrial

Switching Rate
65%
Switched Customers415,000
Deregulated in 1999. Aggregation programs drive participation.

Illinois

ResidentialCommercialIndustrial

Residential

Switching Rate
36%
Switched Customers1,720,000

Commercial & Industrial

Switching Rate
60%
Switched Customers345,000
Deregulated in 1997. Municipal aggregation is significant.

Pennsylvania

ResidentialCommercialIndustrial

Residential

Switching Rate
18%
Switched Customers1,060,000

Commercial & Industrial

Switching Rate
45%
Switched Customers280,000
Deregulated in 1997. Large PJM market.

New Hampshire

ResidentialCommercialIndustrial

Residential

Switching Rate
31%
Switched Customers175,000

Commercial & Industrial

Switching Rate
50%
Switched Customers40,000
Deregulated in 1996. First-in-the-nation legislation.

Rhode Island

ResidentialCommercialIndustrial

Residential

Switching Rate
24%
Switched Customers110,000

Commercial & Industrial

Switching Rate
40%
Switched Customers28,000
Deregulated in 1996. Smaller market.

Connecticut

ResidentialCommercialIndustrial

Residential

Switching Rate
25%
Switched Customers350,000

Commercial & Industrial

Switching Rate
40%
Switched Customers65,000
Deregulated in 1998. Mature market.

Maryland

ResidentialCommercialIndustrial

Residential

Switching Rate
19%
Switched Customers415,000

Commercial & Industrial

Switching Rate
30%
Switched Customers75,000
Deregulated in 1999. Stable PJM market.

Massachusetts

ResidentialCommercialIndustrial

Residential

Switching Rate
15%
Switched Customers380,000

Commercial & Industrial

Switching Rate
35%
Switched Customers170,000
Deregulated in 1998. Mature, competitive market.

New Jersey

ResidentialCommercialIndustrial

Residential

Switching Rate
18%
Switched Customers625,000

Commercial & Industrial

Switching Rate
35%
Switched Customers240,000
Deregulated in 1999. Competitive options across utilities.

New York

ResidentialCommercialIndustrial

Residential

Switching Rate
20%
Switched Customers1,400,000

Commercial & Industrial

Switching Rate
40%
Switched Customers420,000
Deregulated in 1996. Large ESCO market.

Maine

ResidentialCommercialIndustrial

Residential

Switching Rate
12%
Switched Customers85,000

Commercial & Industrial

Switching Rate
30%
Switched Customers45,000
Deregulated in 2000. Early structural unbundling.

Delaware

ResidentialCommercialIndustrial

Residential

Switching Rate
<10%
Switched Customers30,000

Commercial & Industrial

Switching Rate
25%
Switched Customers20,000
Deregulated in 1999. Lower residential participation.

Michigan

Capped

Residential

Switching Rate
<1%
Switched Customers<1,000

Commercial & Industrial

Switching Rate
<10%
Switched Customers5,600
Deregulated in 2000. 10% sales cap constrains market.

Oregon

CommercialIndustrial

Residential

Switching RateN/A
Switched CustomersN/A

Commercial & Industrial

Switching Rate
45%
Switched Customers125,000
Deregulated in 1999. No residential choice.

Virginia

Limited

Residential

Switching Rate
<1%
Switched Customers<25,000

Commercial & Industrial

Switching Rate
<5%
Switched Customers<20,000
Choice is highly restricted; 100% renewable exception.

California

CommercialIndustrial Capped

Residential

Switching Rate
0%
Switched Customers0

Commercial & Industrial

Switching Rate Limited (Direct Access)
Switched CustomersN/A
Residential direct access suspended. Non-residential Direct Access allowed under statutory caps and waitlists.

Nevada

CommercialIndustrial Limited

Residential

Switching Rate
0%
Switched Customers0

Commercial & Industrial

Switching Rate Limited
Switched CustomersN/A
No general residential choice. Limited direct access for certain non-residential customers.

Data sources: Hundreds of individual sources including utility filings, regulatory proceedings, public utility commission reports, ISO/RTO materials, market monitor summaries, and national energy data collections.